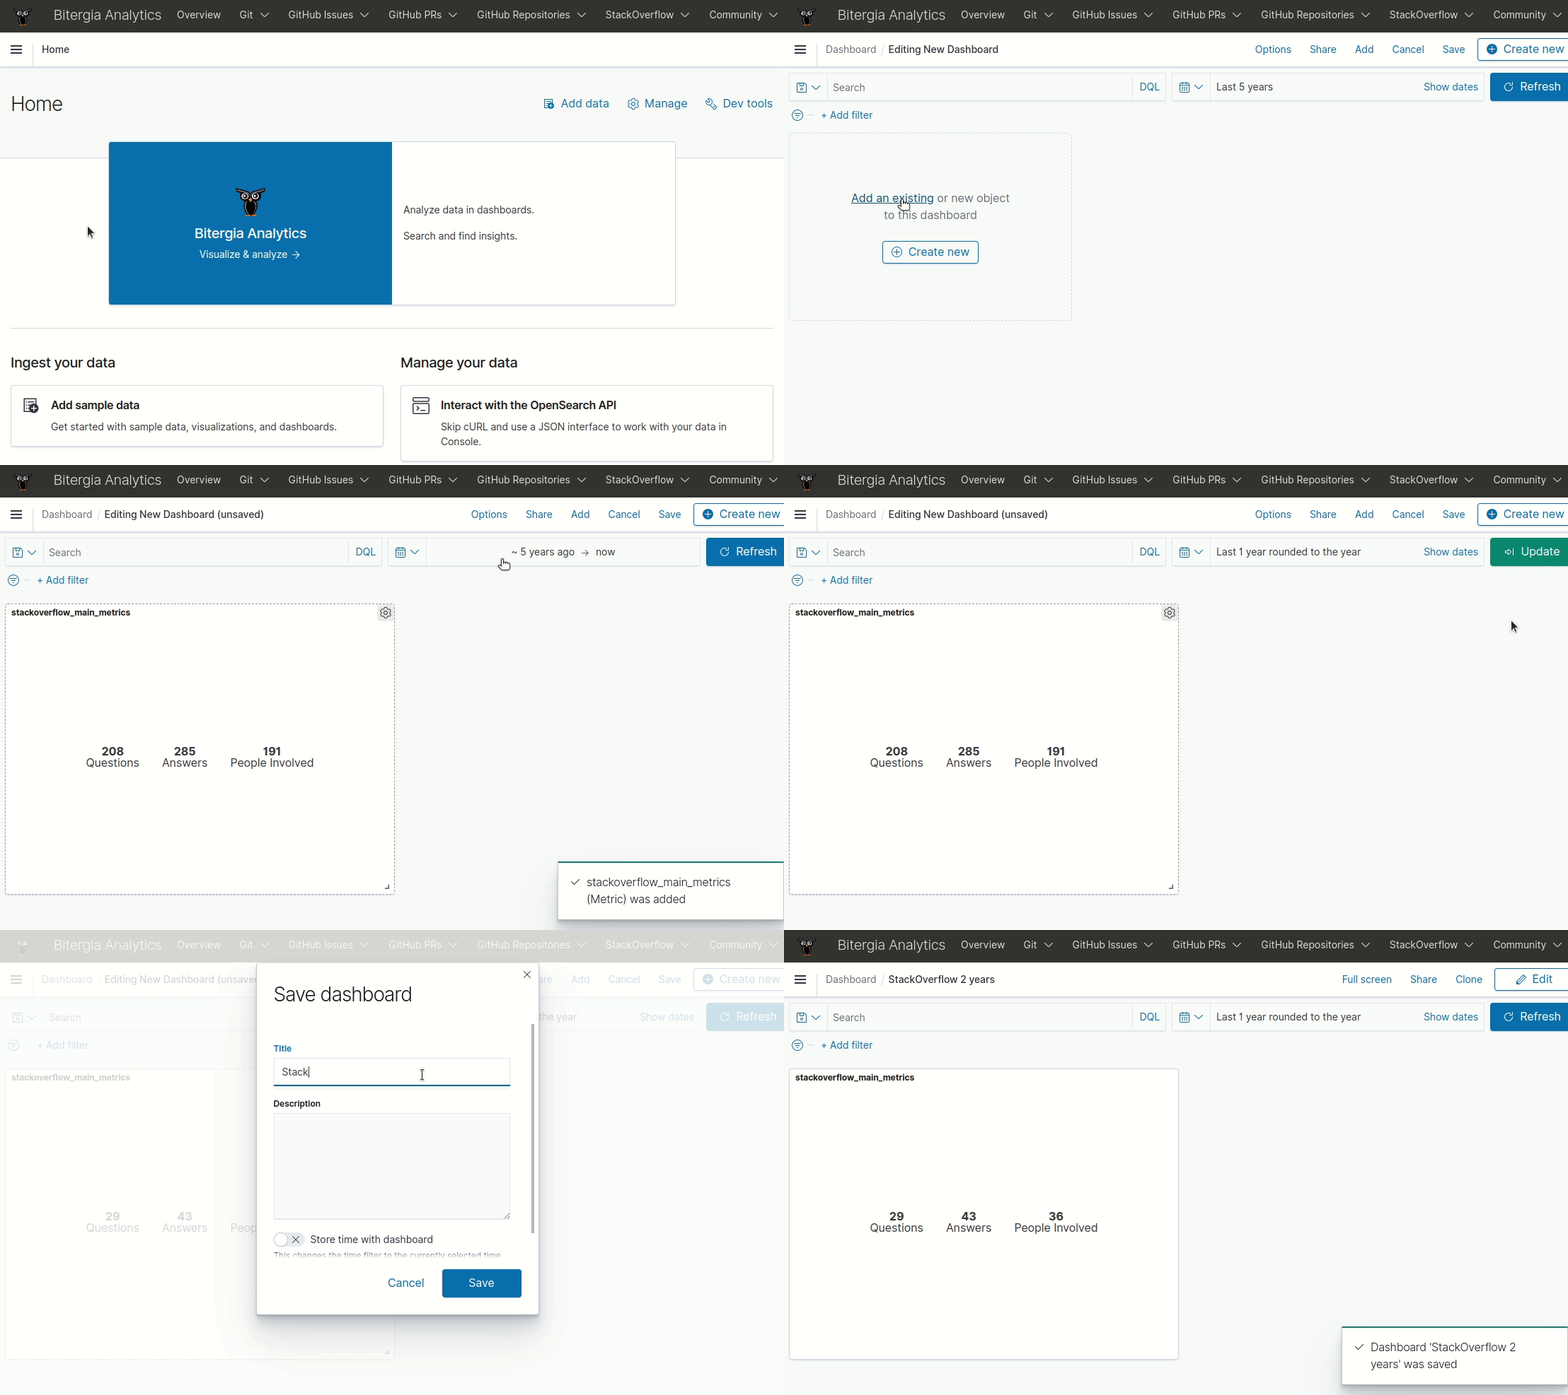
Configure your own Dashboard with custom visualizations
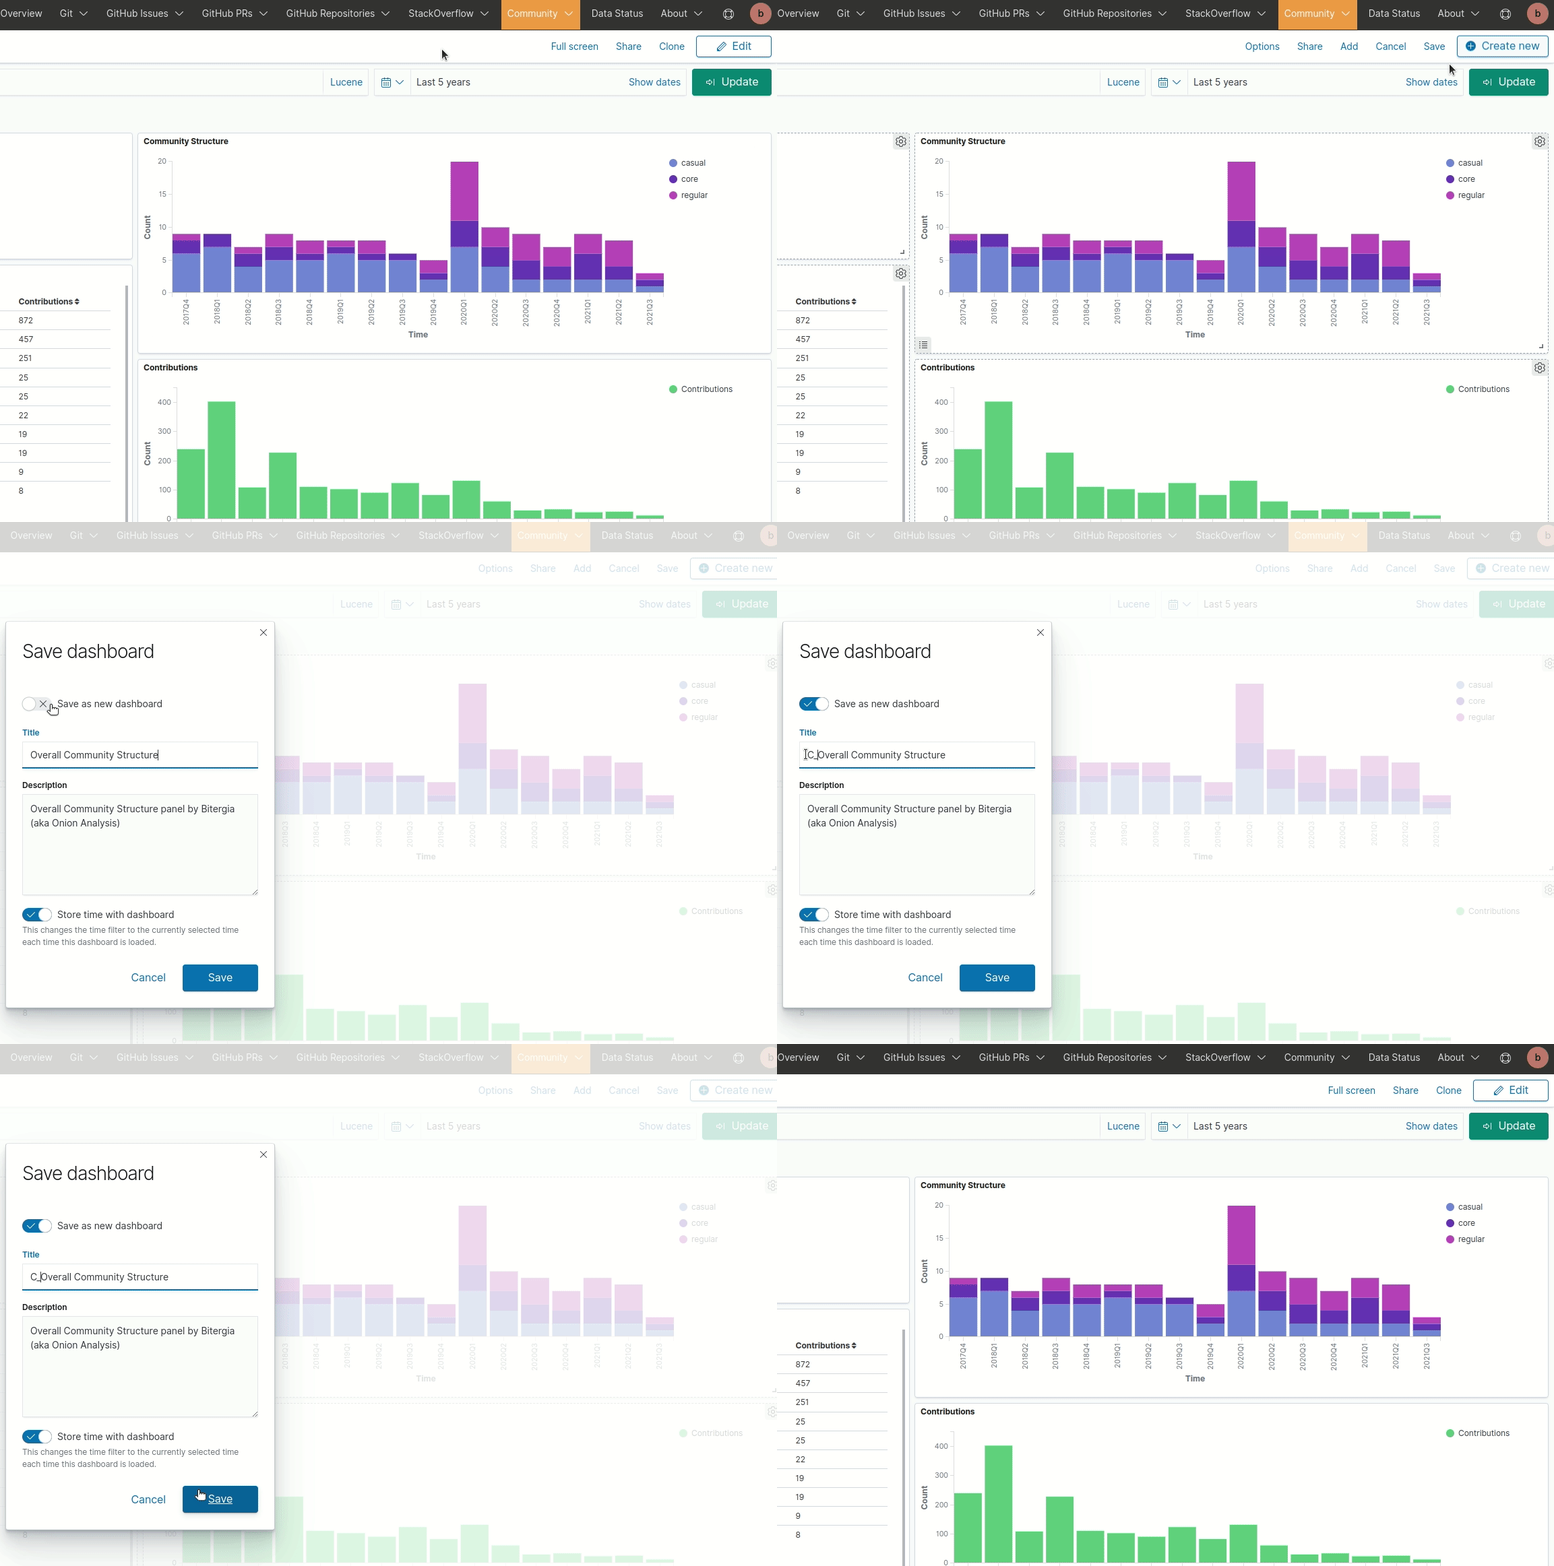
Saving new dashboards or visualizations#
Standard dashboards provided by Bitergia offer a lot of information, however, you may wish to create your own visualizations or/and dashboards or edit some of the existing ones. To do that, you just need to save it properly to avoid Bitergia overwriting your work. It could happen if you store your work by overwriting some standard dashboard or visualization.
The steps you should follow to ensure your work is safely saved are:
- Click on
Edit - Click on
Save - Make sure
Save as new dashboardorSave as new visualizationtoggle button is on. - Give your dashboard or visualization a new name that starts with
C_, this convention will allow us to identify them as your custom dashboard or visualization. For Dashboards, Bitergia ones always contain the wordBitergiawithin the description text.
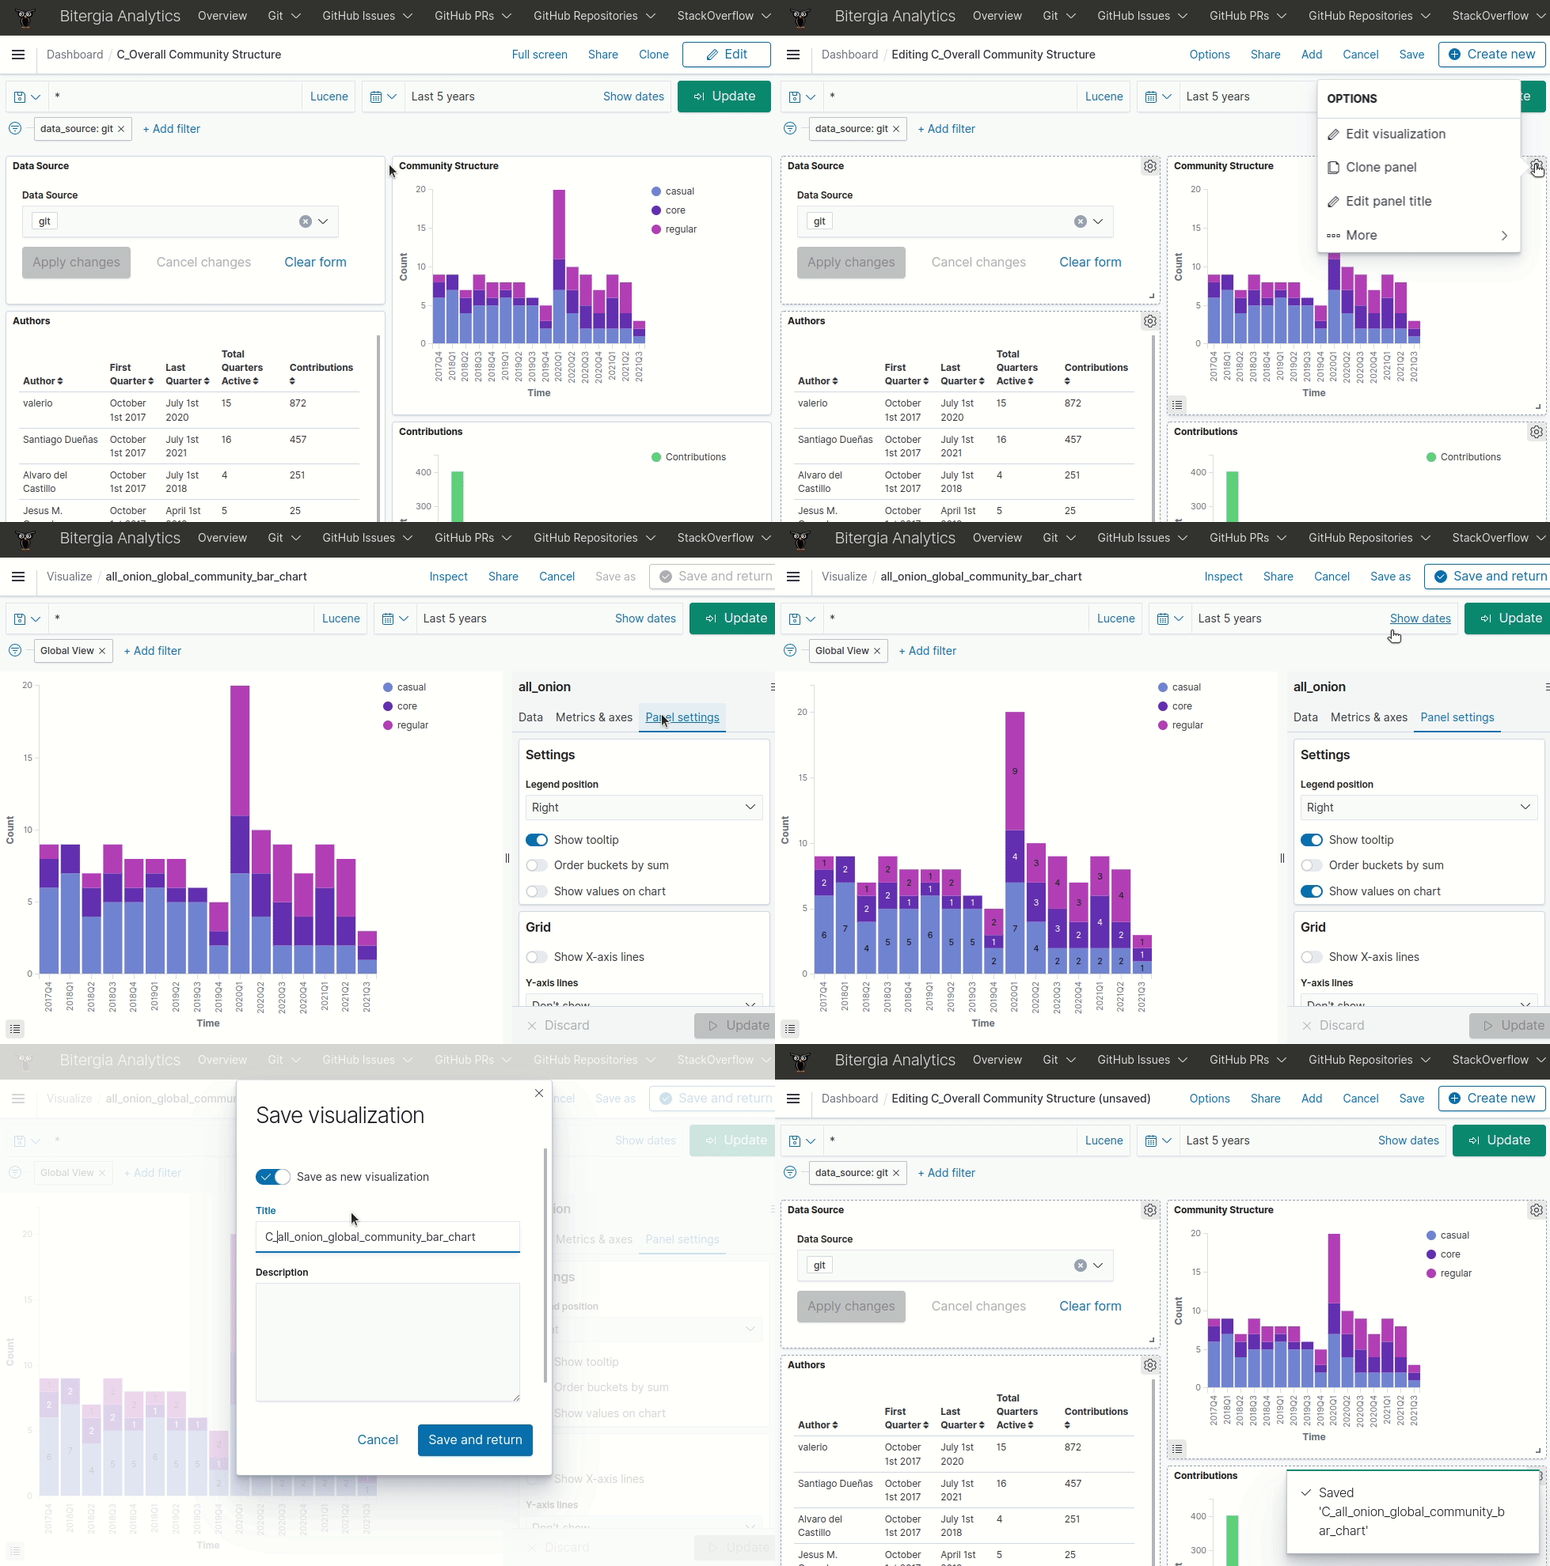
Editing visualizations#
- Login to the dashboards.
- Click on the
Edittab in the top right corner (gears should appear in the top right corner of each visualization). - Click on the
gearicon of the target visualization. - Click on
Edit visualization. - Follow the
saving new dashboards or visualizations
instructions if you are editing an existing dashboard/visualization not originally
created by you. If you are modifying your own object, just overwrite it by clicking
on the button
Savein the top right corner.
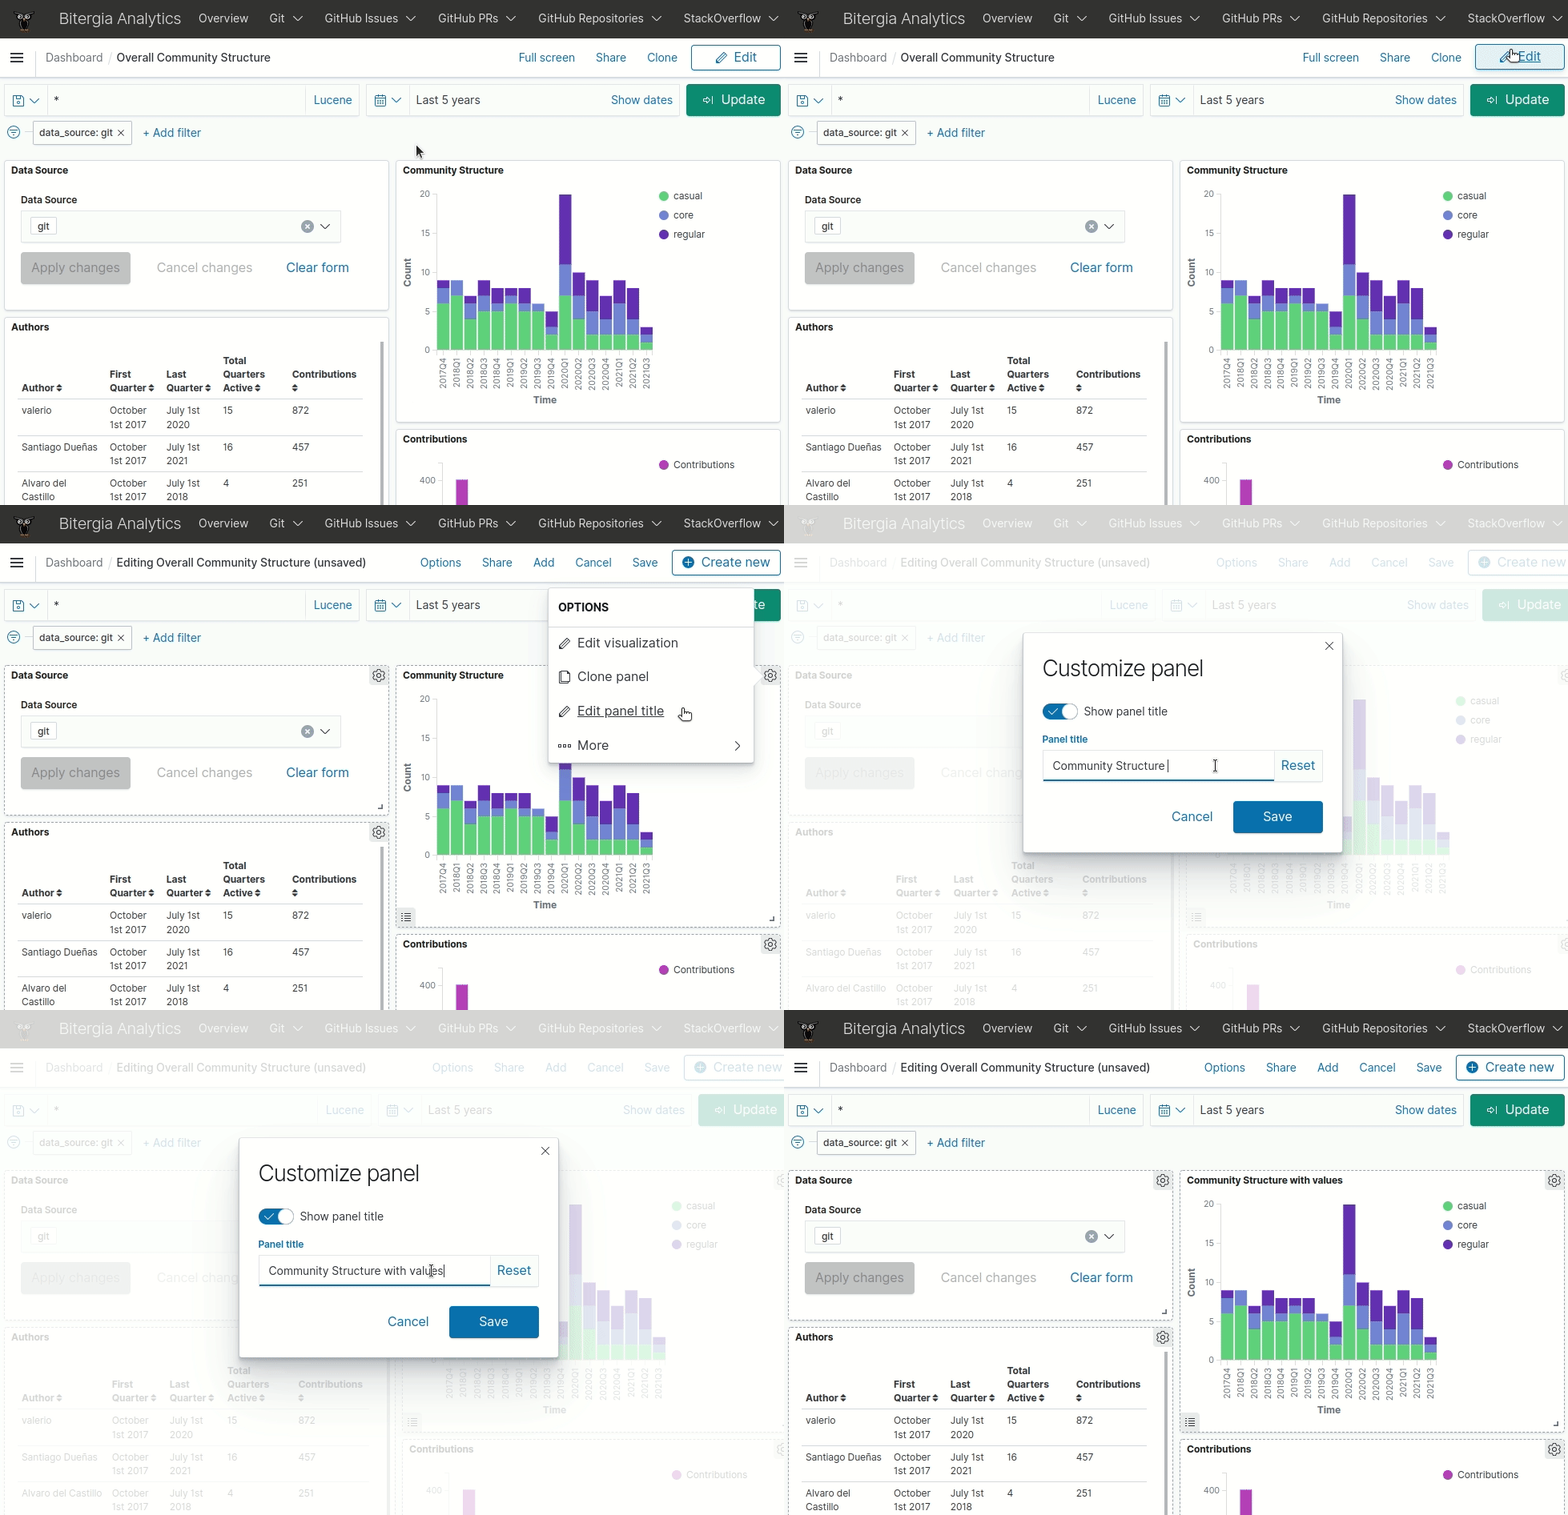
Renaming visualizations#
- Login to the dashboards.
- Click on the
Edittab in the top right corner (gears should appear in the top right corner of each visualization). - Click on the
gearicon of the target visualization. - Click on
Customize paneland change the title. - Once done, follow the
saving new dashboards or visualizations
instructions if you are editing an existing dashboard/visualization not originally
created by you. If you are modifying your own object, just overwrite it by clicking
on the button
Savein the top right corner.
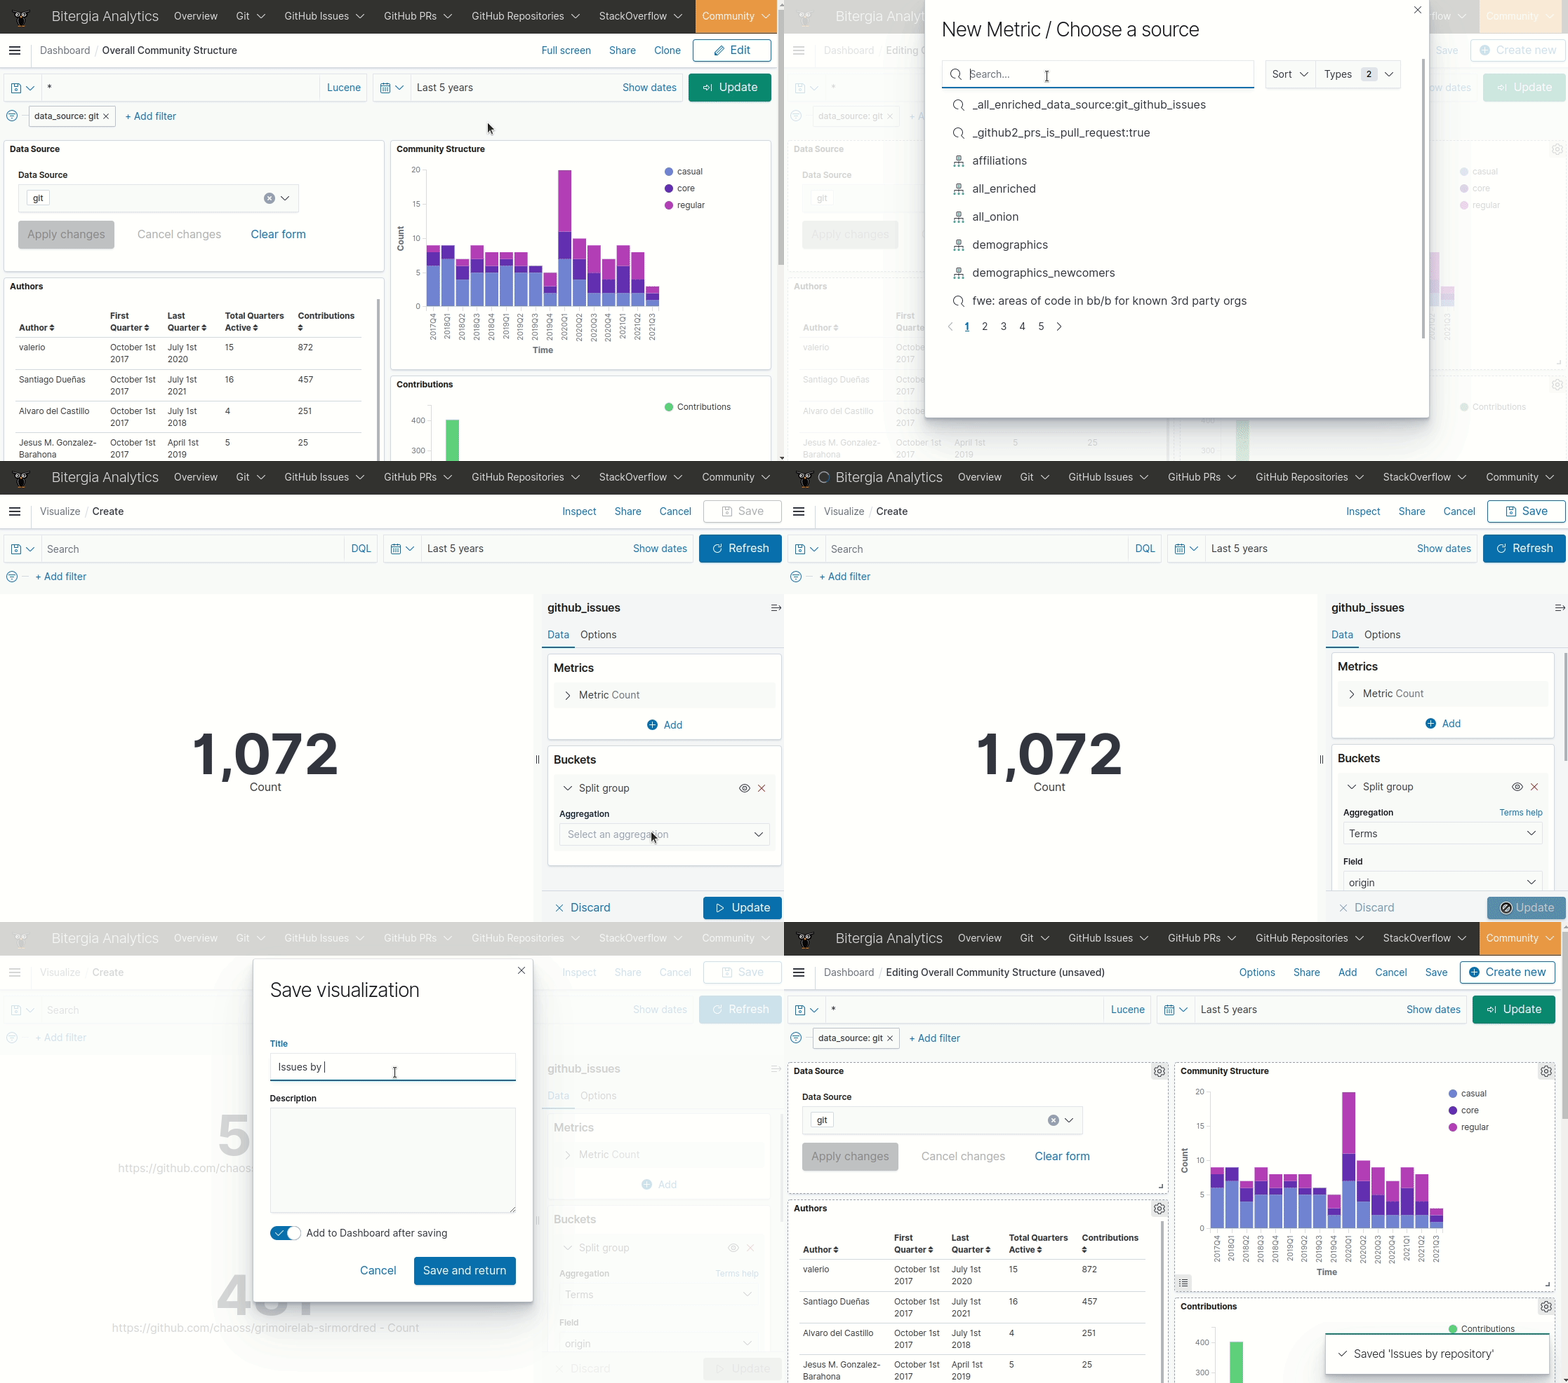
Creating visualizations#
- Login to the dashboards.
- Click on the
Edittab in the top right corner. - Click on
Create new. - Select a visualization type.
- Select a source (index pattern) to create your visualization on top of it.
- Configure the visualization (metrics, buckets...).
- Once you have finised you visualization, click on
Updateand thenSave. - Type the name of the new visualization and click on
Save and return. Remember to start the name of your custom visualization withC_.
Editing a dashboard#
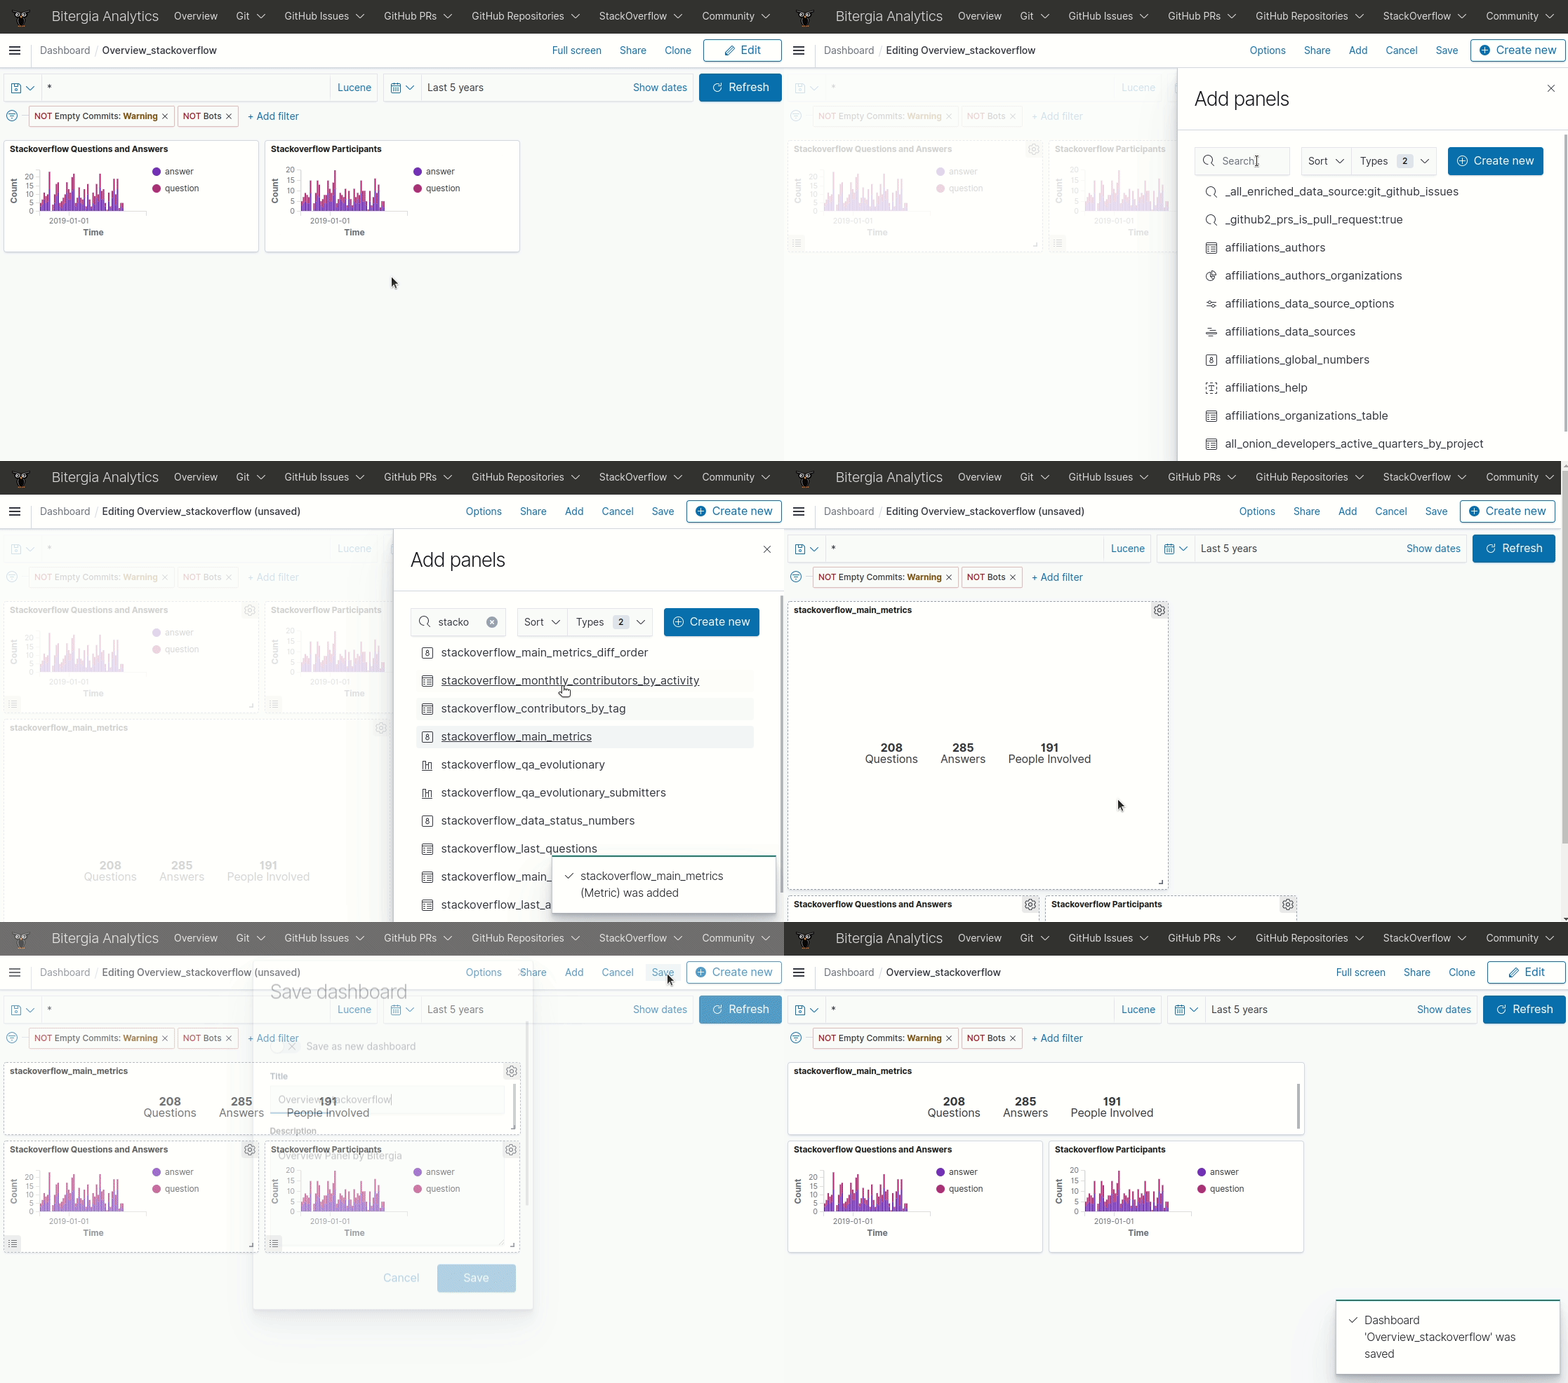
- Login to the dashboards.
- Go to the target dashboard.
- Click on the
Edittab in the top right corner. - Click on the
Addtab in the top right corner. - Create a new visualization or load an existing one.
- Once done, the visualization will be visible on the dashboard.
- Move/resize the visualizations in the dashboard, set filters and time picker (optionally).
- Once done, follow the
saving new dashboards or visualizations
instructions if you are editing an existing dashboard/visualization not originally
created by you. If you are modifying your own object, just overwrite it by clicking
on the button
Savein the top right corner.
Creating dashboards#
- Login to the dashboards.
- Open the left-side sidebar.
- Go to the
Dashboardsection. - Click on the
Edittab in the top right corner. - Select
Add an existingor create a new visualization. - Select the visualizations that you want to add.
- Configure using the time picker the perior that you want to visualize.
- Once done, click on the button
Saveon the top right corner. - Set the title and description of the new dashboard. Remember to start the name of
your custom dashboard with
C_.
